
Spatial Analysis · T0-1
Catchment Study
Travel-time catchments and the population inside them.
Swipe or use ← → to turn pages
空间分析 · T0-1
CATCHMENT STUDY
等时圈研究
以 15 / 30 / 45 分钟车程为界,读出场地可触达的人群规模与结构。
左右滑动,或用 ← → 翻页
At a glance
What the catchment holds
SummaryThe population is dense, majority-male and working-age at every scale. As the catchment widens from 15 to 45 minutes, the profile barely changes — only the size of the pool does: 0.7 M → 5 M → 12.35 M people.
12.35 Mpeople within the 45-min catchment · 1,874 km²
4.96 Mwithin the 30-min catchment · 542 km²
0.71 Mwithin the 15-min catchment · 60 km²
55.3%male share · median age 34.5
By catchment
| Catchment | Area (km²) | Population | Male share | Median age |
|---|---|---|---|---|
| 15 min | 59.9 | 714,496 | 55.3% | 34.4 |
| 30 min | 541.6 | 4,964,573 | 55.1% | 34.7 |
| 45 min | 1,874.0 | 12,315,121 | 55.3% | 34.6 |
The three catchments nest within one another, so the differences are a matter of scale rather than of profile.
关键数字
等时圈里有什么
小结人口在每一个尺度上都表现为「稠密、男性偏多、劳动年龄为主」。等时圈由 15 分钟扩大到 45 分钟,结构几乎不变,变的只是人口体量:70 万 → 500 万 → 1,235 万。
12.35 M45 分钟等时圈内人口 · 1,874 km²
4.96 M30 分钟等时圈内 · 542 km²
0.71 M15 分钟等时圈内 · 60 km²
55.3%男性占比 · 中位年龄 34.5
分圈层
| 等时圈 | 面积(km²) | 人口 | 男性占比 | 中位年龄 |
|---|---|---|---|---|
| 15 分钟 | 59.9 | 714,496 | 55.3% | 34.4 |
| 30 分钟 | 541.6 | 4,964,573 | 55.1% | 34.7 |
| 45 分钟 | 1,874.0 | 12,315,121 | 55.3% | 34.6 |
三个等时圈层层嵌套,差异主要体现在尺度而非结构上。
Region
Population heatmap
SummaryPopulation is heavily concentrated. The great majority of the 12.35 million people in the 45-min catchment live in the continuous Shenzhen and Hong Kong urban cores; the site sits on the eastern edge of that mass, where density falls away toward the Longgang hills.
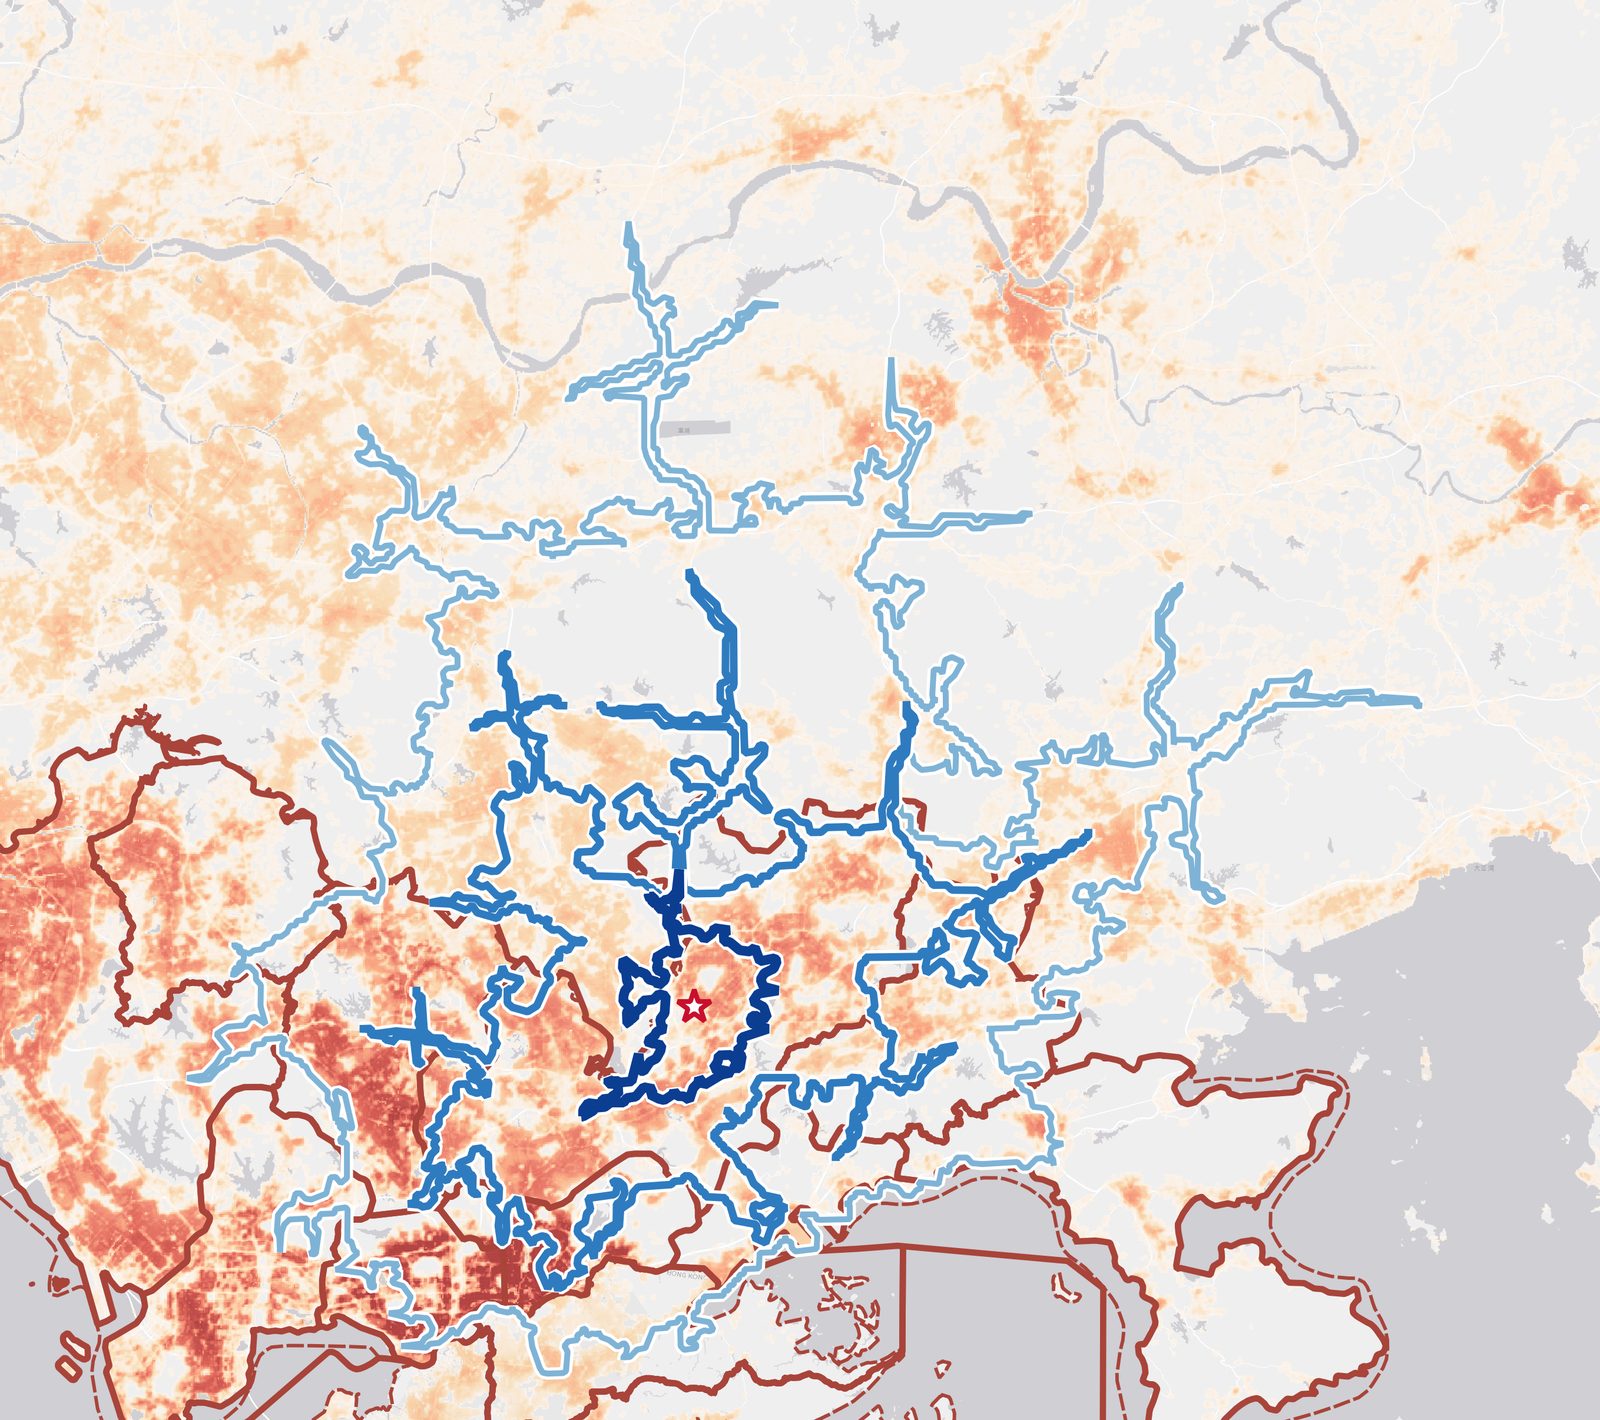 Tap to zoom
Resident population · people per 100 m cell
0360
White → red = low → high.
区域
人口热力图
小结人口高度集中。45 分钟等时圈内约 1,235 万人,绝大多数分布在深圳与香港连续的建成核心区;场地位于这一人口密集区的东缘,密度向龙岗丘陵方向迅速衰减。
点按放大
常住人口 · 每 100 m 格网人数
0360
白 → 红 = 低 → 高。
Site focus
Population heatmap — site focus
SummaryThe 15-min catchment is a mid-density suburban fabric: about 714,000 people across 60 km² — roughly 11,900 per km². Density falls steadily as the catchment widens (≈9,200 per km² at 30 min, ≈6,600 at 45 min), so the site's nearest population is also its densest.
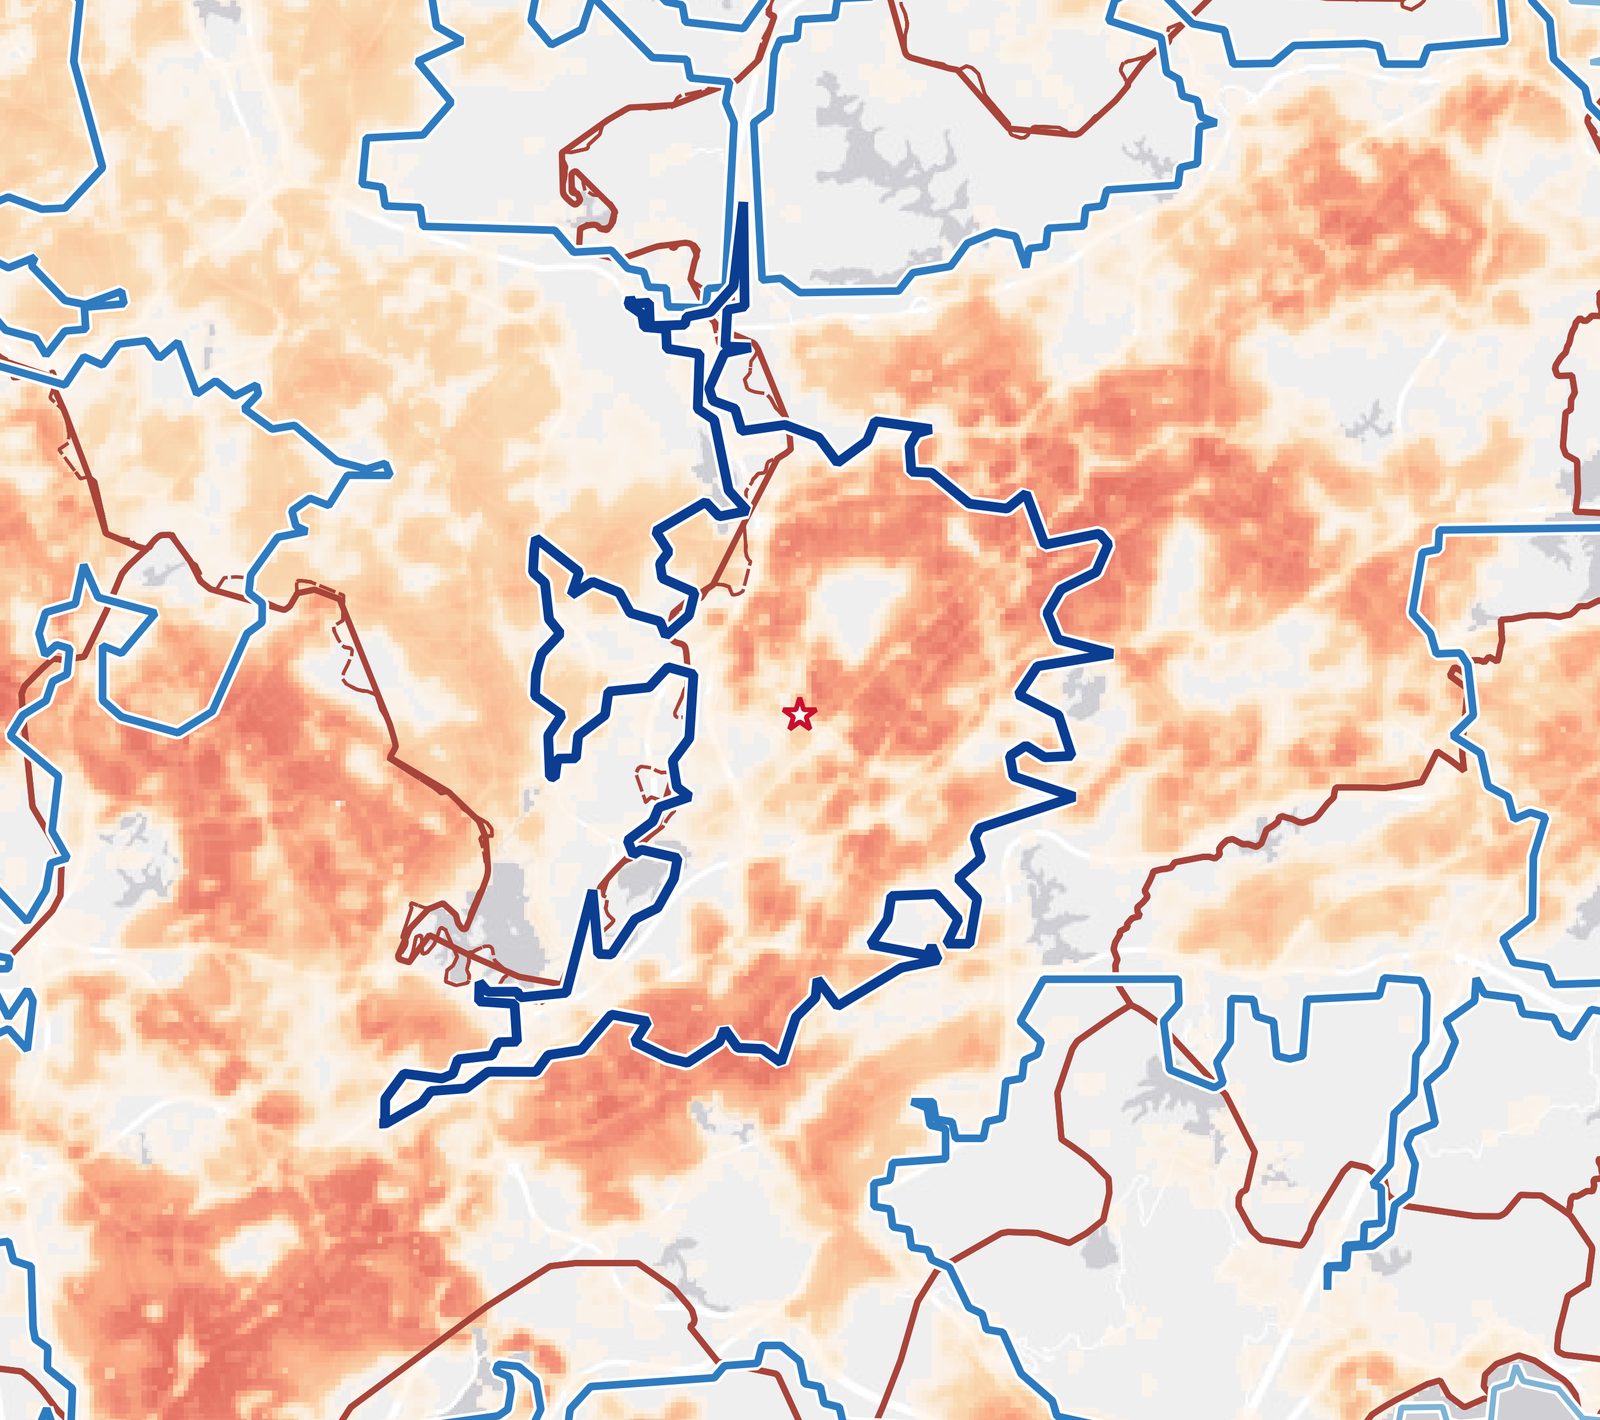 Tap to zoom
Resident population · people per 100 m cell
0360
White → red = low → high.
场地聚焦
人口热力图 — 场地聚焦
小结15 分钟等时圈属中等密度的城区外围:约 71.4 万人分布于 60 km²,约 11,900 人/km²。等时圈越大,密度越低(30 分钟约 9,200 人/km²,45 分钟约 6,600 人/km²)—— 离场地最近的圈层,也正是人口最密的圈层。
点按放大
常住人口 · 每 100 m 格网人数
0360
白 → 红 = 低 → 高。
Gender
Gender ratio
SummaryThe population is consistently male-skewed — about 55% male to 45% female across the entire catchment, from the 15-min core to the 45-min span. The balance is even rather than concentrated: it is a structural feature of Shenzhen's migrant workforce, not a local anomaly.
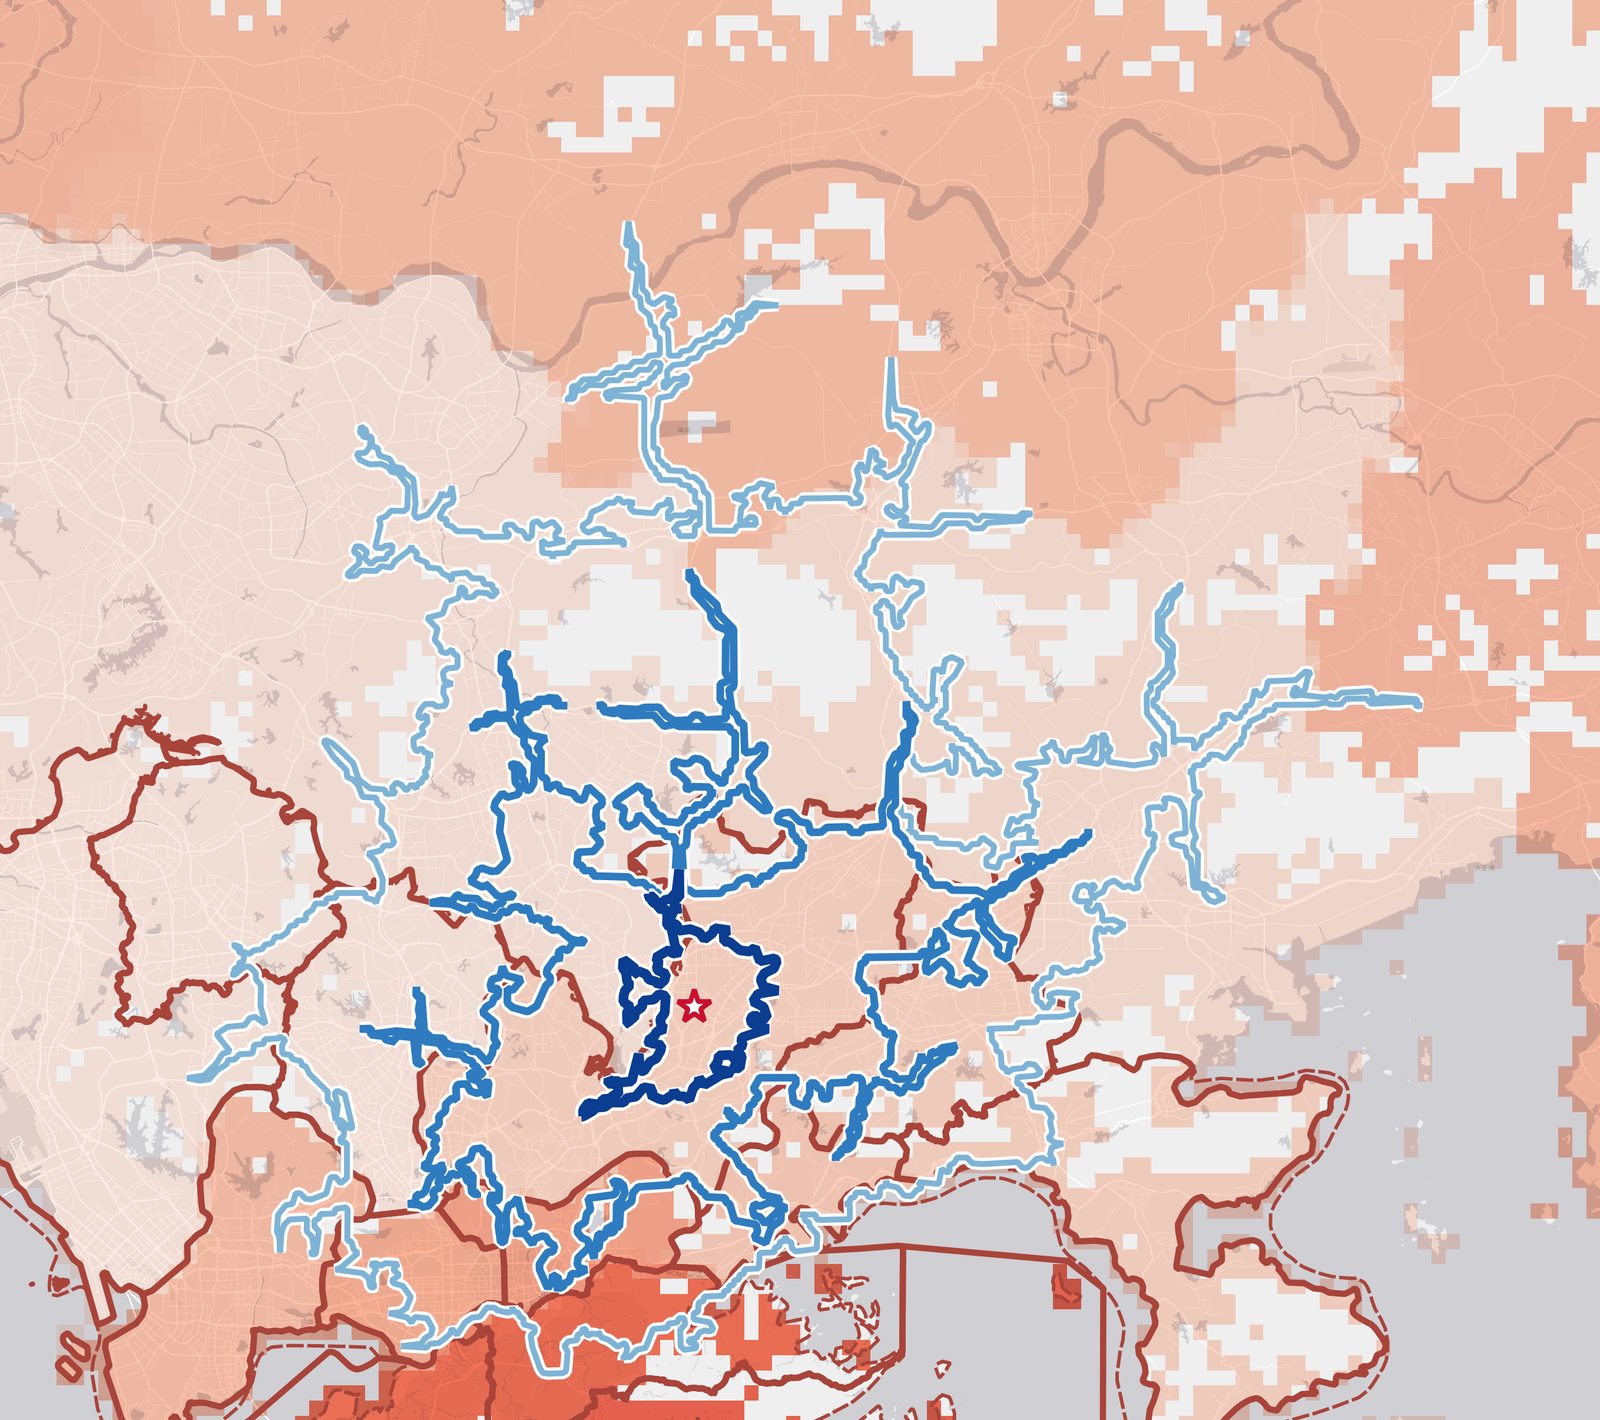 Tap to zoom
Female share of population
40%60%
性别
性别比
小结人口结构稳定偏男性 —— 整个等时圈内约男性 55%、女性 45%,自 15 分钟核心到 45 分钟腹地基本一致。分布均匀,并不集中:这是深圳移民劳动力的结构性特征,而非局部异常。
点按放大
女性人口占比
40%60%
Age structure
Population by age group
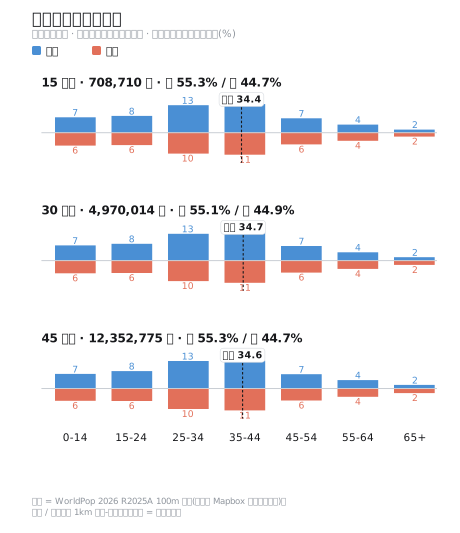
SummaryA working-age population. 25–44 makes up about 48% of every catchment, 65+ is under 3%, and the median age is about 34.5 — consistent from the 15-min core to the 45-min span.
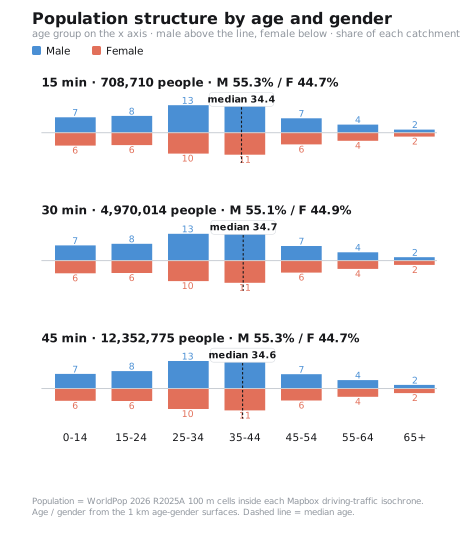 Tap to zoom
年龄结构
人口年龄结构
小结典型的劳动年龄人口。每个等时圈内 25–44 岁约占 48%,65 岁以上不足 3%,中位年龄约 34.5 岁 —— 自 15 分钟核心到 45 分钟腹地高度一致。
 点按放大
点按放大Sources & notes
Sources and notes
Method
- Catchments are travel-time isochrones at 15, 30 and 45 minutes, measured from a single site origin.
- Population is read from WorldPop 2026 R2025A on a 100 m grid; a cell is counted when its centre falls inside a catchment.
- Age and gender come from the WorldPop 1 km age-gender structure; female share is calculated only where population exists.
Sources
- Population and age-gender: WorldPop 2026 R2025A (modelled) · CC-BY 4.0
- Travel-time catchments: Mapbox driving-traffic
- Basemap: OpenStreetMap contributors / CARTO
- Administrative boundaries: Shenzhen and Hong Kong
Notes
- Population figures are modelled estimates rather than a census count; read them as orders of magnitude.
- Travel times are estimates under typical conditions, not observed journey times.
来源与说明
来源与说明
方法
- 等时圈为 15 / 30 / 45 分钟车程的等时线,自同一场地原点量取。
- 人口取自 WorldPop 2026 R2025A,100 m 格网;格网中心点落入等时圈内即计入。
- 年龄与性别取自 WorldPop 1 km 年龄‑性别结构;女性占比仅在有人口的格网内计算。
来源
- 人口与年龄‑性别:WorldPop 2026 R2025A(模型数据)· CC-BY 4.0
- 车程等时圈:Mapbox driving-traffic
- 底图:OpenStreetMap contributors / CARTO
- 行政区边界:深圳、香港
说明
- 人口为模型估算值,非普查数据,请按数量级理解。
- 车程为常规路况下的估算值,非实测通勤时间。